Recruiting tours, fairs and the associated travel expenses are some of the biggest line items in an institution's recruiting budget. Given the investment of time and money to achieve student recruiting goals through travel, we hear the same great questions every year related to this topic. How do you know if you're getting the most bang for your buck in terms of recruitment travel? This is article is part one of two on this subject.
You and your colleagues have likely pondered these questions about recruitment travel:- How much of budget should I allocate to travel and tours?
- Where should I go and send my staff?
- With whom should we travel?
- Which travel activity, tour and fair has provided us with a return on our investment (ROI)?
- Do we have data to back up our decision or are we relying on friendly referrals from colleagues and hearsay?
While we don't publicly endorse any individual providers, Intead has prepared an Intead Index list comparing tour providers (Intead Index: Tour Providers for International Student Recruitment) that should help you to consider several options.
Furthermore, let us share some benchmarking data that can help you track future performance. If you have collected the data in your marketing systems or customer relationship system (CRM), you may be able to create the analysis.
From our experience, you will need multi-year data to solidly evaluate the complete ROI on recruiting tours since you will meet students at different stages of their research and enrollment processes. Many of them will not apply and enroll for two to three years after you meet them at a fair. Be sure to track from day one.
We are looking at a few basic marketing metrics that will help you assess the capabilities and quality of student flow provided through your fair provider.
- Will the fair organizer provide you in a timely manner with a verified contact list of the students you meet or are you responsible for collecting the information? If you are responsible, do you have a system to collect the information?
Chart 1 shows you an initial quality analysis of the contact information across a range of locations and fair providers. We all know that the volume of students will differ from fair to fair. Some providers will also give you the entire attendee list whereas others will only give you the students who registered directly with your university.
We see two major differences between fair providers in issues that affect initial responsiveness of students:
Timeliness of the contact information provided
and verification of the contact information
Chart 1 shows you the bounce rate between various locations and providers. With some providers, the school lost up to 24 percent of their prospective leads from the fair provider. Others have a consistent track record of providing verified emails. Just to be clear, verification doesn't mean the student will convert to an applicant, but it gives you the opportunity to follow up.
Chart 2 highlights the open rate and click-through rate to the offered content. In this data set (same school, same recruiting period and content offer), open rates ranged from 24 percent to 52 percent. The click-through rate for this campaign ranged from 4 to 27 percent. We analyzed the correlation and here are a few important takeaways:
- Students who had direct interaction with your admissions staff or representative will respond at a higher rate to your follow up communication.
- The sooner you respond, the greater the likelihood that students remember and will reply. Obviously, there are other factors depending on the type of school and communication. For instance an email highlighting scholarship offers in the subject would get a higher open and response rate.
- Insist on verified data from your provider so that you don't lose your valuable prospects due to bad emails or non-existent social media accounts.
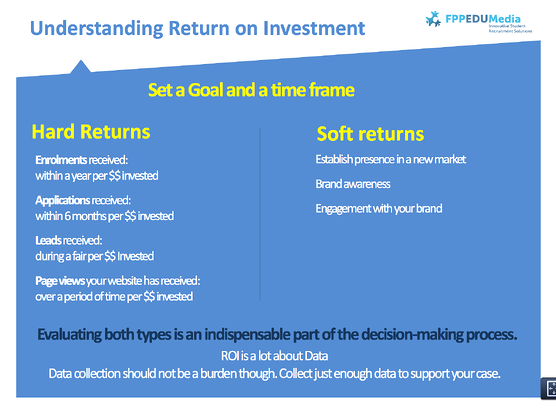
Chart 3 is a useful summary of how to think about the hard return (quantifiable) and soft return (less or not quantifiable) from investing in using tour and fair providers. The summary slide is from a presentation at the most recent NAFSA conference in San Diego.
Not surprisingly, the hard returns focus on the leads generated and converted to enrolled students, while the soft returns are gained through the learnings of entering a new marketing and the brand support provided for your university.
For additional information, you can review the slide deck from the NAFSA 2014 session Measuring the Return on Investment of International Education Fairs.
Chart 1
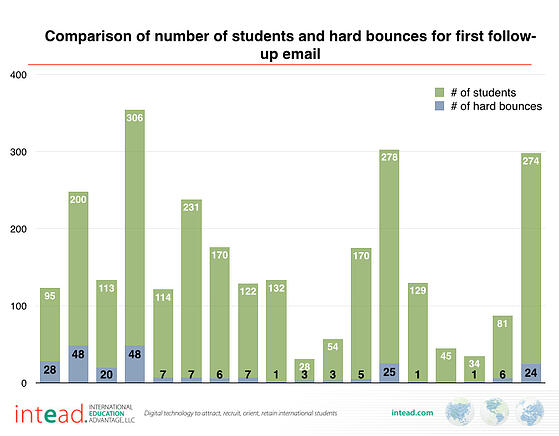
Chart 2
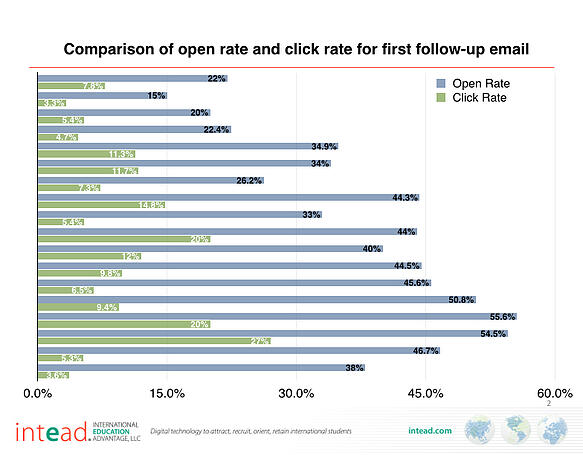
Chart 3