What are the Top 3 Metric Areas you should be tracking? Does your answer match ours?
Former CEO of HP, Carly Fiorina, once said, “the goal is to turn data into information and information into insight.” This is the essence of analytics. It’s exactly why you are (or should be!) taking the time to track traffic on your website and social media engagement. It is all for that valuable insight that can introduce you to the student leads you want and help you understand their needs/motivations.
We know we might sound like a broken record but analytics are important. And we know how difficult it can be to get started. The good news is that it’s not as complicated as you think.
Come meet us in San Diego this weekend (a quick jaunt to the sun!?!) to learn more about metrics, tactics and other international student recruiting approaches from experts in the field at our upcoming International Student Recruitment Bootcamp. It is all about What Works Where.
Have you seen our speaker list? A range of experts, our conference faculty, will be on hand January 29-31. Today is the LAST DAY to take advantage of regular pricing. Spaces are limited and going fast.
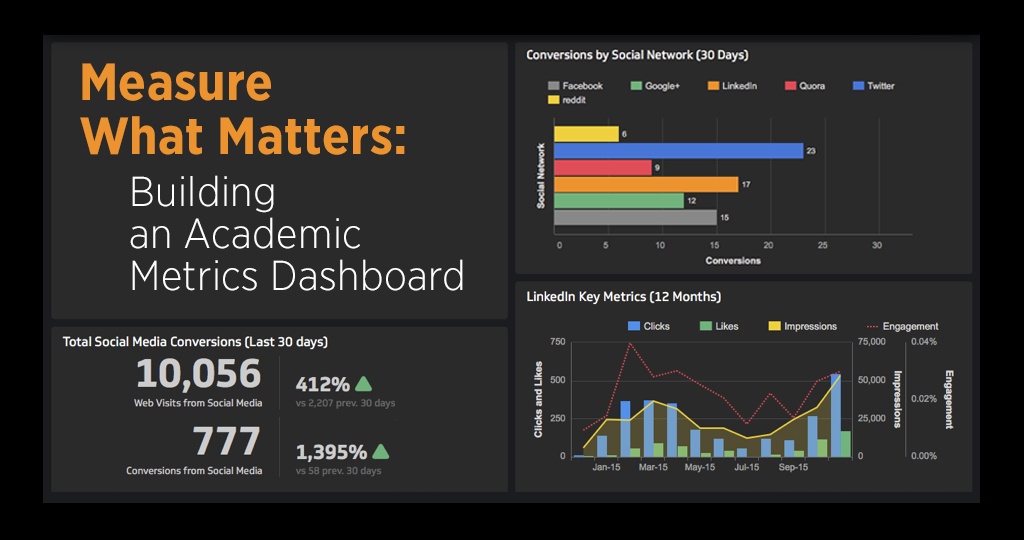
The Bottom Line: The key to successfully tracking analytics is to set up a system that is easy to use and accessible–your dashboard. Just like your car dashboard, a metrics dashboard stores all your “go-to” data in one place. This can help know how your digital marketing is performing. If you take the time to do this regularly, a big IF based on what most of us have time for, you will spend your marketing budget more wisely every year. If nothing else, your bosses will be proud of you for that ;-)
Trying to collect data without setting up a dashboard is like trying to make a recipe you’ve never made before without the ingredients list. You might know where to find one or two of the pieces of data you are looking for, but you need to know how to piece them together to make a tasty meal. Read on for our list of the Top 3 Metrics Areas we think you should be keeping tabs on. This is the kind of data we think should be on your dashboard to support your international student recruitment efforts.
Pro tip: this is one of those posts you’ll want to share with a select few others on your team.1. The Social Media Dashboard
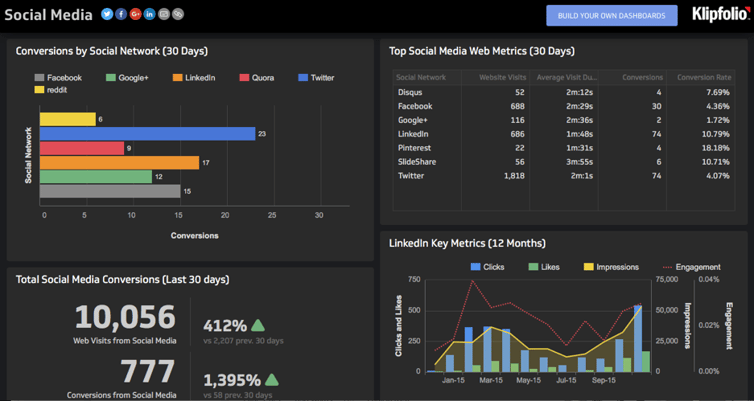
Know which channels and which posts/topics/ads are working for you.
With a social media dashboard, you’ll want to track things like views, clicks, visits, the duration of visits and specific stats for each social media platform you use. For example, you’ll want to know how many “likes” your posts received on Facebook, how many times your institution was mentioned on Twitter and how many follower click on your links. Klipfolio offers a great example of a social media dashboard set-up. If this example doesn’t work for you, trust us, there are a lot out there to choose from.
2. The Website Content Marketing Dashboard
Know which website pages are working for you.
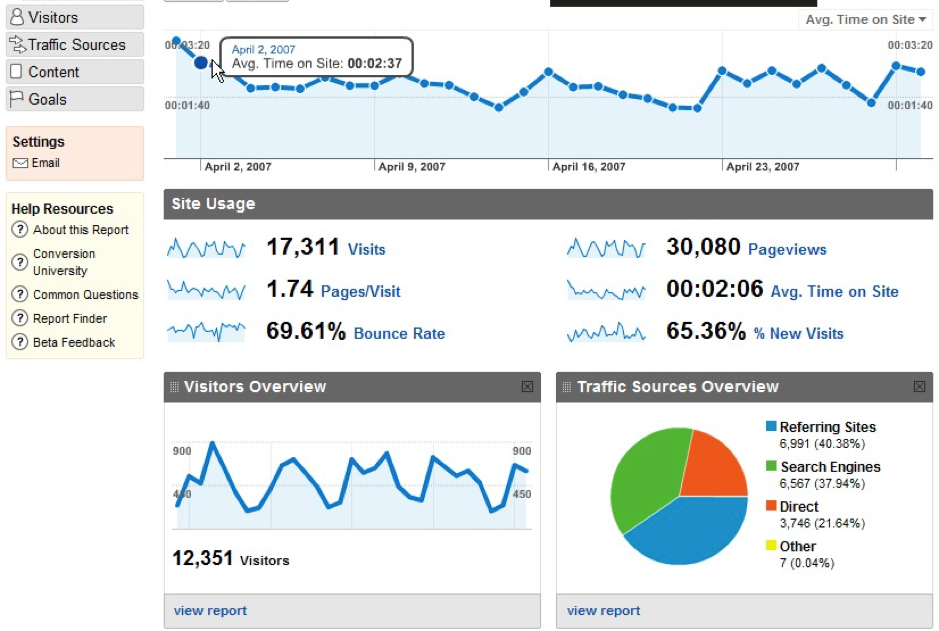
The website content marketing dashboard is focused on content marketing and draws information from Google Analytics--another great application to help you start measuring. The content you have on your website can make or break the relationship you are trying to create with a lead who will likely never visit your physical campus unless they enroll. This dashboard provides insight into your website traffic as a whole; Google Analytics cannot identify specific visitors (leads) by name or any other identifier.
This dashboard can help you track things like page visits, bounce rate, page views and the average time spent on your site – by country. You can even break visitor traffic down by city, i.e., did you see an uptick in website visits in the days after your Shanghai college fair? Would be nice to know that.
Google Analytics provides a basic kind of tracking that is an absolute must if you want to work on improving your content and evaluate how your other recruiting activity drives website traffic.
3. The Inbound Marketing Dashboard
Know how your digital marketing is engaging and converting specific leads and the actions each lead is taking based on your content.
A bit more in-depth, the inbound marketing dashboard shows the leads you generate and how well you sell. It is a bit like your social media dashboard combined with your content marketing dashboard and then some. There are tools out there that can pull all the data into one place for you. You can also pull them together on your own using excel or the like. That route take more time (which you don’t have).
Mike Lieberman, president of Square 2 Marketing gives his take on an Inbound Marketing Dashboard using Hubspot. His list of must-have analytics is as follows:
- Organic search visitors
- Referral visitors
- Social media visitors
- Rankings for selected keywords (3 to 5 very important ones)
- Blog subscribers
- Blog views
- Top viewed blog articles (and the views) during the past 30 days
- Top downloaded content (and the number of downloads) during the past 30 days
- Net new contacts
- Total increases in social reach (across all social sites)
4. Bonus Metric Area (Surprise!): The Application Progress Dashboard
Know how well your digital marketing is producing applications and enrolled students.
This one is oh, so important. It is all well and good to track how well your digital activity and online content engages prospective students. But if you don't know if that activity is driving prospects to start and complete applications AND THEN enroll, you have not tracked enough data. Tracking doesn't end until you know that enrollment status. To get there you need reports from your SIS (student information system) or whatever it is you are using to track the progress of applications.
Now you are ready to truly evaluate the effectiveness of your marketing spend!
Get Measuring!
There are plenty of dashboard tools and applications. In addition to the ones mentioned in this post, try Alexa.com, Hootsuite and other online CRM software (Salesforce) and email marketing and marketing automation platforms (MailChimp, Hubspot) to track the engagement of your leads.
Another benefit of many dashboard applications is that they can track your personal progress. Hootsuite, for example, offers “internal analytics” within their analytics package. This can help determine the success of individual team members in certain areas and help your recruiters assess and improve their digital activity.
Get Some Help!
If you are new to metrics, we suggest picking just one dashboard to start (plus the bonus dashboard: The Application Progress Dashboard, so really that's two dashboards). This ensures that you aren’t overwhelmed and that you take the time to measure each key performance indicator (KPI) properly. Find a stats grad student walking around campus and drag them into your office (offer cookies if you have them…works like a charm).
The added value of analytics is incredible, which is also why there is so much choice when it comes to dashboards. Don’t be afraid to start off small, it will give you big returns. Leave us a comment to let us know how your metrics journey is going and if any of the tools we’ve recommended have been helpful. We love hearing your ideas!