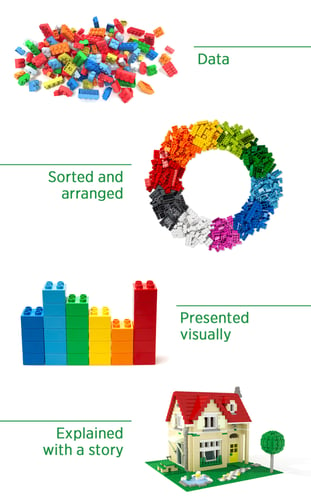
There’s so much richness behind data analysis. However, it’s not very often that institutions fully explore the data already available at their fingertips.
Today’s post comes from Patricia Tozzi, our Chief Strategy Officer. Taking a quick break from her directing Intead’s client campaigns, we asked her to give us perspective on how she approaches the inquiry into all the data that surrounds us. How she deploys her innate curiosity to develop campaigns that succeed for our clients.
We hear the desire to improve marketing efforts, innovate, and influence decisions that will result in real enrollments. Yet, it’s hard to get new ideas to take off due to limited resources and institutions’ slow-moving pace. This we all know from our years of experience working with academic institutions.
Our take is there are valuable, free resources you may be underutilizing (or not using at all) that can help you gain insights and, hopefully, lower some barriers to innovation.
Thomas F. O'Toole, associate dean for executive education and clinical professor of marketing at the Kellogg School of Management of Northwestern University, expresses our experience so well, “I hear people say ‘We need data scientists.’ Well, yes, very selectively—but what you need more broadly are people in different types of functions who are able to translate business needs and problems into data analytics, manage the data required, perform the analytics, and then apply the analytic output in the execution of marketing initiatives and activities.”
Patricia is such a translator.
What we often see are academic leaders who smile, nod, and make a joke about their math skills not being what they should be. Is this you?
No shame in recognizing your skills and skills gaps. But what are you doing about it? Because leaving all that data untapped is not an option.
Read on to learn how to tap into what your existing data is trying to tell you. We think this two-part series is one you’ll want to share more broadly within your institution.
And, if you’ll be attending the 2022 AIEA conference in New Orleans (Feb 20-23), be in touch and we’ll find time for a coffee and an exchange of ideas.
Stay curious. Let the data lead the way.
A recent Harvard Business Review article notes that 90% of business leaders cite data literacy as key to company success, yet only 25% of workers feel confident in their data skills. We won’t argue with that stat. Maybe you can even relate.
You would be surprised with what you can find when you dig into your data. We often see that surprised look in our clients faces when we assess their existing data.
Recently, we identified a strong connection one of our client’s faculty had abroad. Unbeknownst to the university or the professor himself, he was responsible for bringing web traffic and enrollments from a country in which the school did not have any presence.
Our curiosity about their enrollment and Google Analytics data brought an opportunity to light. This professor’s popular blog was resonating in his home country and his readers were checking out his institution.
What happened next? An internal chat with the professor to ask his readers for their advice on recruitment efforts in his home country. An opportunity to build important relationships, engage target audiences, and create a more diverse student learning experience.
Regular data analysis makes us all much more creative and effective, not to mention how much better the brainstorming sessions become when there’s more data and knowledge available to power idea generation and problem solving as a group.

We can share more stories of unexpected results. Like the time our university client was unaware that the CRM they had set up with tracking was missing a few connections. 8+ months of “tracked” data was not actually tracked in any way that informed enrollment planning.
Trust us, they have really smart teams there and they simply missed some key connections between the CMS and Salesforce. It happens, and the data reports don’t always show you where steps were missed.
According to a NewVantage survey, 99% of firms have invested in data initiatives and 92% reported the pace of investment is accelerating. So why aren’t there more data-driven organizations? The main challenge to becoming data-driven is not the technology (7.8%) but the people, business process, and cultural aspects (92.2%).
-Forbes, 2021
The takeaway
The connection between your enrollment/admissions operation and your decision support (analytics team) is so important. Some institutions build it into enrollment management and other enrollment teams have to go begging to other departments.
What can you do to integrate these analytics skills into your enrollment operations? Can an outsource team be available to you for instant decision support? Can an internal team member get a 6-month online certificate so you can quickly build the in-house talent you need?
This ability to translate and communicate the data story into actionable insights will improve your results. Truly improve your results. You simply need to take the time to do the work well, thoroughly.
Up next: How to get started
If your team is lost in data translation, then reach out to us. We often uncover some surprises and always reveal the story your data is trying to tell you. Next week, Part 2 of this series explores actionable steps you can take now to strategically and accurately interpret the data you already have (even if you don’t know it yet).


