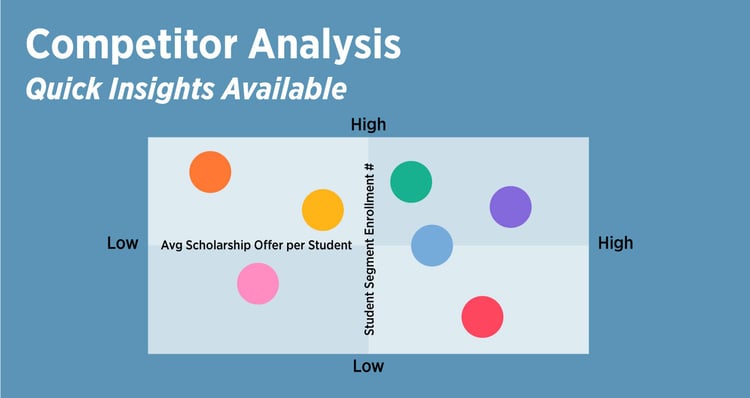
Every enrollment VP is fighting for students who will add value to their institution. Domestic is heading for the 2025 cliff while international is beginning to rebound from the pandemic travel restrictions.
What better way to win market share than to tell the story that differentiates your institution? This week, for those of you not already familiar, we introduce you to Jon Boeckenstedt and a tool he’s created that can help you see quickly how your institution stacks up to your competition. Jon’s work consistently brings data insights and knowledge of the field to help institutions make better enrollment management decisions.
On the international side of things, be sure to register for the AIRC conference coming up in December where we will be presenting two valuable learning opportunities alongside colleagues from Northeastern University, Fordham Law School, and San Diego State University. Early bird rates are still on the table! See link below. And see you in Miami!
Read on to dive into the amazingly fast competitor insights you can gather and how you might use them to put the best version of your institution’s story out there.
We all know that institutions thrive or wilt based on their ability to find, analyze, and act on data to fulfill their mission and execute their strategy. We also know that using data effectively is not always an institution’s strong suit.
There is so much campus push back about “run it like a business,” but using data for decision making is not “run it like a business.” It is simply smart. Being human about business decisions is also smart. The whole “run it like a business” debate is worthy of another blog post on another day.
To add even more challenge to the current scenario, your enrollment teams are likely fully tapped.
Here's the thing
Jon Boeckenstedt, Vice Provost of Enrollment at Oregon State University and 30+ year industry veteran, has made his mark diving deep into data to tell clear, compelling stories and inspire novel questions. In his most recent blog, Jon created an easy-to-use, interactive tool that we think can up your enrollment game by providing quick insights into how you measure up against your competitors.
Drawing from IPEDS data, Jon created a way to easily show pandemic-era enrollment in institutions of your choice in six different ways: overall type, overview, grid view, state view, ethnicity, individual college.
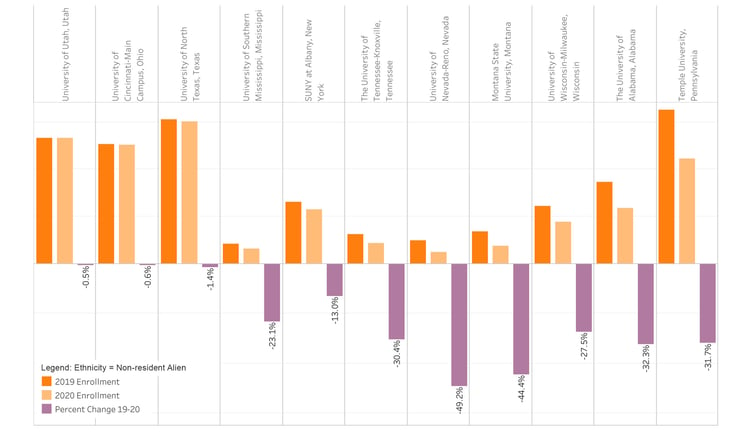
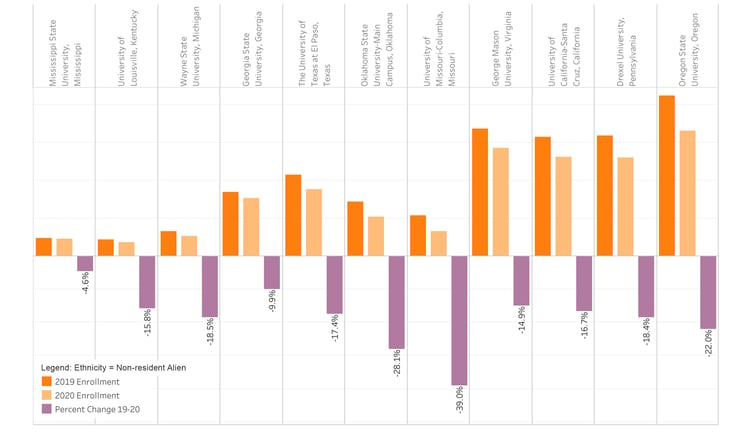
To try out the tool, we chose to explore international student enrollment in the last two years. We selected the universities in our charts below based on the following criteria: R1 not-for-profit institutions, geographically diverse, not in the US News and World Report’s Top 100, and enrolling fewer than 2,000 international students in 2020. We then divided them into AIRC member institutions and non-AIRC member institutions to come up with our two charts (below).
We were wondering if institutions with access to AIRC’s best practice tools for agent contracting and management, along with the training programs and the agent network AIRC cultivates, would these institutions do better with international student enrollment than those without all those benefits? Some did, and some did not. Really depends on how an institution executes the plan among other factors.
Want to learn more about international enrollment from some of the best in the industry? Join us at the AIRC annual conference. Always one of our favorites.
Important to note that institutions across the US and around the world took huge enrollment hits during the past 2 years. Only a handful of institutions survived unscathed. Over the past decade, IIE data tells us each year roughly 33% of all US institutions experience a decline in international student enrollment. With the pandemic, that percentage shot up. Way up. Especially for graduate programs (MBAs and others). The challenges are real.
With a special tip-o-the-hat to Jon and his "Higher Ed Data Stories" blog, let's take a look at a selection of R1 institutions and how they did with enrolling "non-resident alien" students (such an incredibly poor choice of words).
AIRC Member Institutions International Student Enrollment 2019 and 2020

Non-AIRC Member Institutions International Student Enrollment 2019 and 2020

As you already know, larger schools with more robust internal infrastructures and greater brand recognition tended to fare better in the shadow of the pandemic. What may be more interesting to you, however, is using Jon’s interactive charts to see how your institution stacked up against the institutions you know are drawing away your accepted applicants. Take a test drive to see how it might be useful to you:
- Compare how your institution measures up on key indicators (maybe Latinx enrollment growth/decline). The results might inform how you position your institution’s academic strengths and your highly-engaged campus community.
- Identify aspirational schools and drill down into their metrics so you can consider corollaries for your own institution.
The best marketing plans aren’t created in a vacuum. The best plans directly reflect a strategy that leverages the strength of your institution specifically in comparison to competitor institutions. Jon’s interactive charts can help you look quickly and carefully at how you perform against your competition and help you ask the right questions to inform your marketing strategy.
Students and families are evaluating higher education with an even stronger focus on tuition rates and the correlation to job placement. Not just any job placement, they want to know if your graduates land jobs in their career of choice.
Families in the US and overseas consider many of the same factors in selecting their institution and yet they bring their cultural differences to the decision. Now is the time to ensure that your institution is telling its most compelling story about why it is the best fit for the students you want, for each market segment. One size message does not fit all.
If you are seeking more guidance on any of the topics we’ve addressed here, please be in touch. We’re here for you. And follow Jon on Twitter. You’ll appreciate his data, his humor, and his enrollment insights (his blog is worth a read as well). ; -)


