You only thought you were using data to make smart decisions.
Understanding how to use data to support institutional planning and growth requires talents and skills that are learned and practiced and honed over time. All these tech companies selling tools and platforms into our systems want leadership to believe that all is simple, clear, and that their dashboards will transform your operational planning and decision making. Wondrous growth is just a click or two ahead. If only.
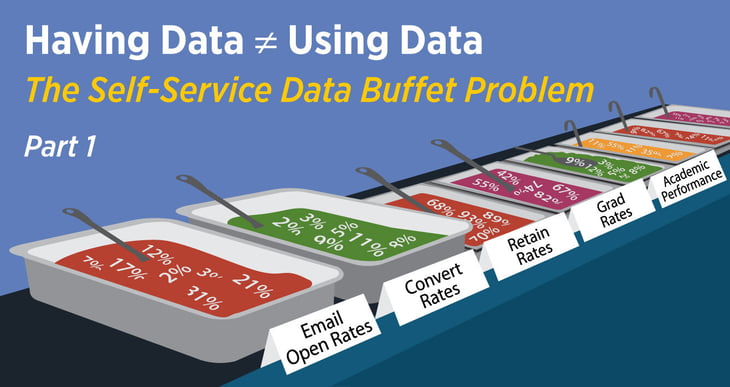
You’ve tried to create a self-serve data buffet for your leadership team so that they can dive in on their own and make informed decisions.
But…what if they’re not?
We mean, you gave your full team access to the tools with loads of features and data reporting. In the realm of marketing, your CRM captures and reports on email open rates, click through rates, conversion rates, and so much more. Your marketing dashboard tools pull data from Facebook’s Business Manager and Google Analytics (with updates to GA4 that your team is scrambling to implement and fine tune as you read this).
We all want to eke every last drop of data from the platforms available to us now.
Truth is, in the battle of data informed decisions vs human nature, human nature usually wins. Reality: creating, viewing, and understanding reports is not as simple as the tech vendors tell you it is.
Many of your leadership team are simply not data people. They may grab some of the data that supports their ideas, but ignore relevant data that would add more insight, nuance, or might even negate their suppositions.
What we have seen over the last decade is that many organizations are assuming their team’s new access to data dashboards and tools will naturally result in effective use of those tools. Often leaders simply don’t prioritize learning the necessary bells and whistles in the midst of other important deadlines. Still others can’t wrap their heads around it. They have other skills that your institution values and data analysis/interpretation is simply not one of them.
Simple test: Your marketing dashboard provides you with your email open rate monthly average. Among your other standard emails last month, on the 10th your team sent a mass email to a newly purchased, cold email list. What is worth reporting on to your leadership team? How can the data available inform your decisions and actions?
Read on to learn more about what self-service data is, why it can be useful, and how to actually make it work for you. (Oh, and we answer the question about the email open rates).
Typically, there are one of two possible results to the leadership data access buffet:
- Your institutional leadership maintains a blind ignorance to the reality of ineffective use of the tools as leaders pick the data they like or simply the data they understand, and then ignore the rest. So decisions are made without a strong and accurate understanding of the factors that truly influence success.
- Your institutional leadership is aware and experiences frustration as senior leaders come to meetings without having explored, analyzed, and understood the data that is at their fingertips. The data that the organization invested so much time and money into gathering and displaying.
So, what to do about it…
Organizations have been slow (at best) to hire the consumer and operations insights teams that must accompany the technology tools. The field of statistical analysis has been growing for more than a decade.
Note the growing number of Business Analytics masters degrees your own institution is conferring. And this: per the National Center for Education Statistics (NCES), the number of bachelor’s degree programs in Mathematics and Statistics increased nearly 18% from 2010/11 to 2019/20. The career prospects for these graduates is also growing. The U.S. Bureau of Labor Statistics projects a 31% employment growth for mathematicians and statisticians from 2021 to 2031, much faster than the average for all occupations (which is about 5%).
The world of big data is one thing and has made big headlines for a while. But there is also small and medium data that businesses and yes, academic institutions, are paying more and more attention to. Where there is glamor in big data, there is gold in small and medium data.
Getting an entire team, let alone the institution, to fully embrace and use this data to inform best practices and make great decisions, well that can feel more pie in the sky. But it doesn’t have to be that way. There is a right way to get the most out of your data.
Defining the Data Use Problem
Slate. Banner. Marketo. Tableau. Salesforce. Mailchimp. Google Analytics. Sprout Social. Maybe Jenzabar? You get the point. There is no lack of tools that provide self-service reports for the novice or the advanced among us. These tools allow us to bypass the IT folks and institutional research/consumer insights teams to get data-informed perspectives from our laptops, on our own. And the manual work it replaces is priceless. How did anyone ever get anything done before this automated era? Mind boggling, right?
Many institutions hire business analysts to build dashboards that pull data from these tools into specific visualizations that indicate company KPIs (key performance indicators) and the like. Those analysts may be short-term consultants or part of your institutional research team. They are in high demand and typically overworked.
The goal of self-service data is to give you quick access to information that will help inform key decisions. Use it to pinpoint new market opportunities. A couple basic examples:
- In student recruitment: Data will tell you where students tend to lose interest in the recruitment process. Heck, you can know at what point in your latest student testimonial video viewers bail. Is it before the 7 second mark? That means you haven’t hooked them with your opening.
- In student services: Data is helping your team improve student outcomes when you can see trends that contribute to why students fail to thrive. Perhaps 28% of students who miss four consecutive classes during a semester don’t graduate in 4 years. There’s a key performance measure that could prompt a valuable intervention program.
- In internationalization: Data points to the value of cross-cultural education as an element of student success. An increasing number of studies are pointing to higher levels of academic success and employability of students who study abroad. See:
Really any number of questions can be informed, if not outright answered, by gathering and reviewing the data. And many of our systems have that data in them. It is simply not being reviewed by the folks with the skills to identify the opportunities.
We are back to human nature and the range of skills your team actually has vs. what you wish they had. It’s going to be ok.
Let us help. We can help you think through your data goals, business unit needs, the valuable data sources, and your best steps forward. It’s the kind of strategic work we’re doing every day. And we’d love to do it with you.
As to email open rates: the anomaly of doing a mass email to a cold purchased email list is a great test. Separating the results of that email distribution from the rest of your standard monthly emails is clearly important as you compare month over month results. Comparing the cold email results to your email to other lead communication results will also be telling.
We find that email communication with leads acquired and cultivated through digital marketing (paid social campaigns) and other channels (fairs, agents, direct inquiry, etc.) perform far better than purchased lists. You’ve seen that too, right? A simple example of how your team needs to explore the data behind the basic dashboard numbers to make smart decisions.
Next week, we look at the 5 steps to better use of self service data. Stay tuned.