Our aim with the original 88 Ways to Recruit International Students, published in 2012, was to create an accessible compendium of international recruitment tactics for edu institutions. The download took off. At the time of publishing, we were hoping to get 300 downloads. We hit 10X that number in a couple months.
So successful and widely used by academic and enrollment leaders in 2012-2013, a number of edu service providers in the field (our competitors) started paid search campaigns using our ebook title as their keywords ; -). Digital indicators that we were on to something.
We have received terrific feedback and suggestions over the years from enrollment leaders. And we owe a debt of gratitude to our original authors, Lisa Cynamon Mayers and Michael Waxman-Lenz for their vision and groundbreaking research to compile our first edition back in the day. Our field has changed with new tools emerging (generative AI), others going away (remember Renren?).
Currently, in 2025, some of our mainstay data sources (IIE, IPEDS, and EducationUSA) are truncated and under threat of disappearing as we go to press with this edition. Previously unthinkable. Also, potentially making some of our writing in the section called “Recruiting with US Government Support” a bit risky. Hopefully, that does not require an update too soon.
A truly valuable addition to our latest edition: The intead team has been conducting market research and publishing our findings in our blog for more than a decade. Almost every summarized entry in this edition of 88 Ways has a link taking you to Intead’s deeper analysis of how that particular idea can work along with relevant data.
So, yeah, you’re welcome.
Meet Intead!
- Find us at APLU in June, NACUBO in July, and NACAC in September. Be in touch to share a cup of coffee in person.
Bookmark this: Intead’s Resource Center
Access 800+ articles, slides decks, reports with relevant content on any topic important to enrollment management and student recruiting. Check it out.
Over the years, the Intead team has contributed to the evolution of our field. In 2012, the world was still crawling out of the 2008 market crash. (Remember AIG? Bear Stearns? Credit Default Swaps?) International student enrollment numbers were really starting to climb. And digital marketing was just starting to mature.
For perspective, the first iPad was released in 2010. In 2012, Facebook had almost 1 billion users. (Today, it has more than 3 billion.) Back then, Renren was very popular and growing as the Chinese Facebook alternative.
Here’s an interesting digital tidbit: Google Vine launched in January 2013 and died in 2017. TikTok arrived on the scene in 2016 and by October 2018 was the most downloaded app in the US. Today, 3 billion downloads worldwide.
So, yeah, it’s been a minute and much has changed.
Where are we now? In 2025, there are new global threats to the economy, to geopolitical safety, to student mobility. Generative AI is THE hot topic. WeChat is on every Chinese citizen’s phone. WhatsApp (owned by Meta, Facebook’s parent company) is one of the preferred communication tools for 2.75 billion global users (think Southeast Asia, Africa, and Latin America).
Importantly, there are many, many new enrollment leaders and practitioners out there who are trying to make sense of it all. Enrollment leaders are trying to bring their new hires up to speed with a global perspective.
That’s no easy task.
This is where our 88 Ways ebook truly shines: as a resource that helps folks old and new to the field get a quick overview of the many channels, tools, tactics available to help enrollment teams find and recruit relevant pockets of international students around the world.
The reality that no institution has the resources to market to the entire world prompts smart leaders to evaluate options and focus investments where they have the greatest return value, the greatest potential for success.
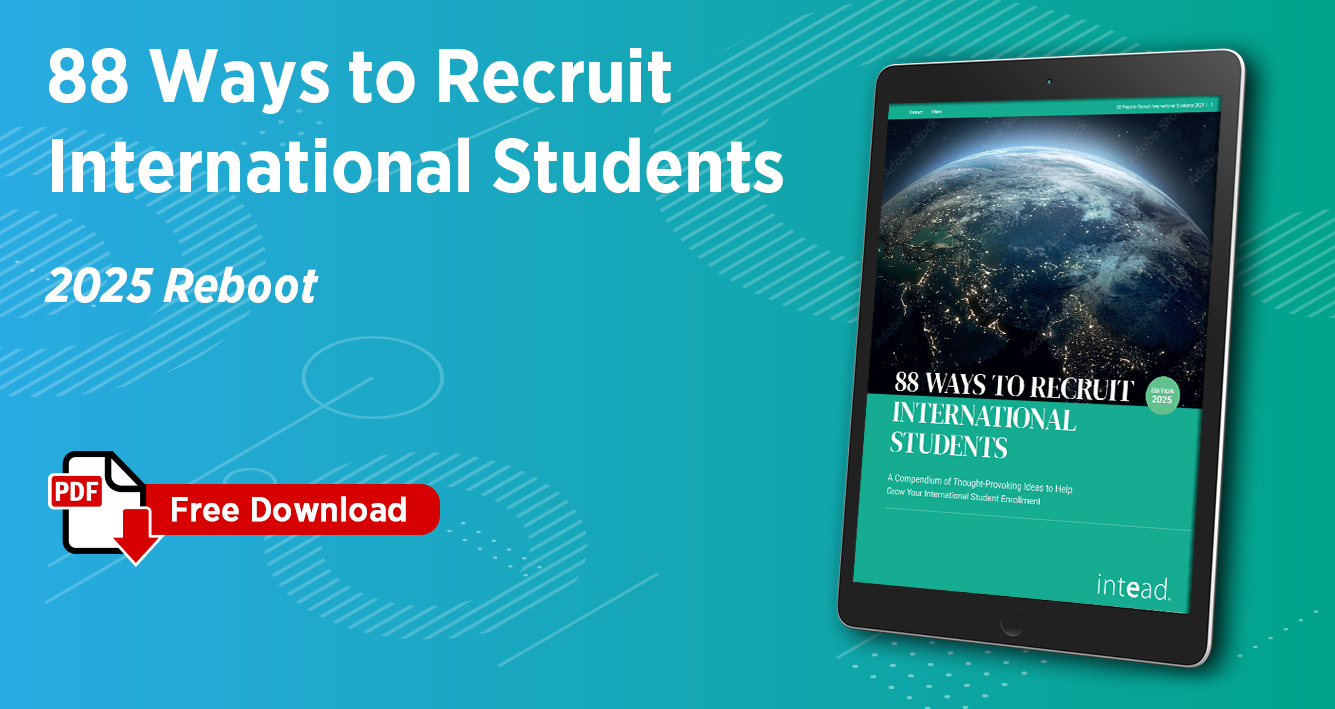
We’ve given 88 Ways a reboot to reflect the current world of enrollment operations and opportunities. We’ve updated the suggestions, retired a few ideas, and offered up new recruitment insights that will no doubt spur worthwhile ideation from your team – whether your institution is US-based or not, this compendium will get you and your team thinking.
Read on to download our rebooted ebook…
Read More