Recruiting Intelligence

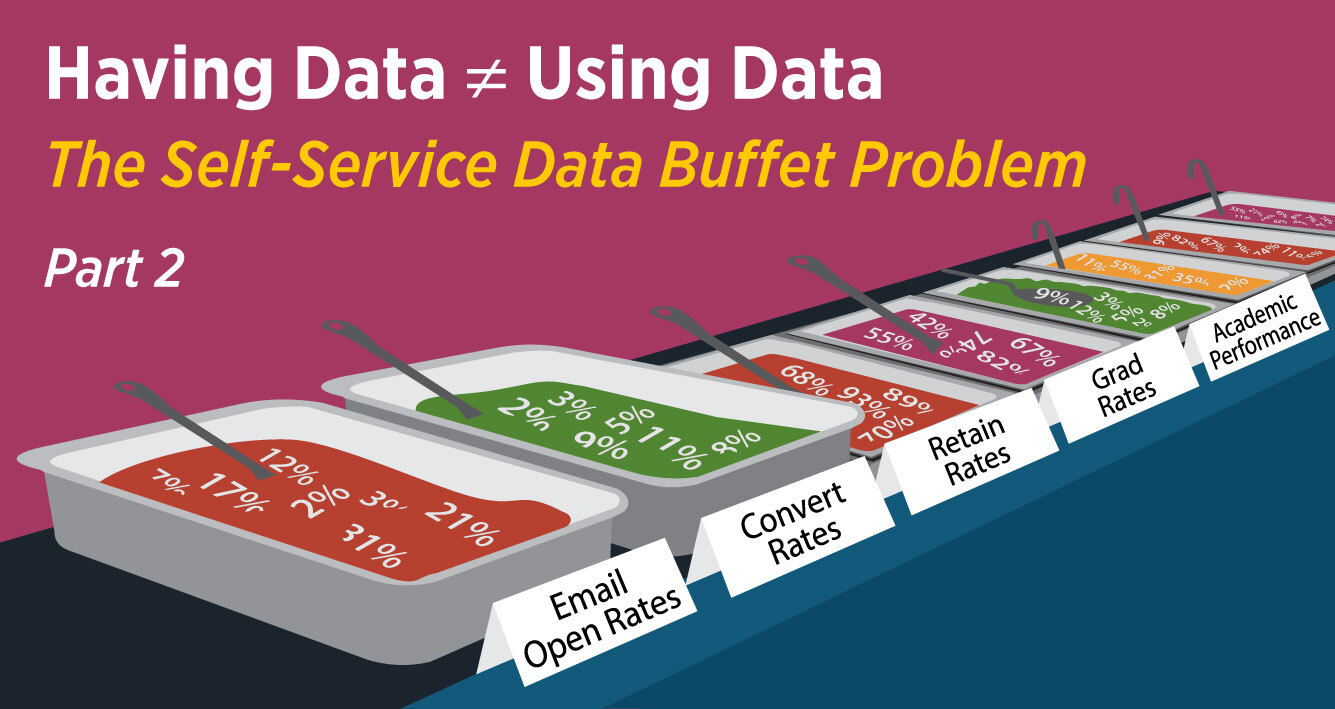
Having Data ≠ Using Data Part 2

Last week’s blog post helped define the data use problem. This week, taking us further into what to do about it.

Trust us, you’re not the only team whose data is not living up to its potential. It’s fairly common within teams and business units. It’s an issue of lack of time and/or lack of skills, but a problem worth solving. 

Because, without well-played data, your team is making decisions based on gut reactions and are more likely to participate in group think. That route is often poorly informed and heavily biased. Data informs and confirms. 

Data also drives curiosity. When your brain (or your team) has one of those aha! moments based on data, it craves more. New  market opportunities start to unveil themselves. New approaches to doing the work (operations) emerge. Prospective student enrollment pain-points will become more apparent – and the ramifications of leaving those pain points unresolved. 

Sure, data won’t solve these problems – that’s up to you – but it will help ensure the problems you’re solving are the ones worth pursuing. Data should be the foundation to most of the decisions you make.

Now, we don’t want to overstate it. Data is not magic (though what our data gurus pull out of the hat can feel like it!). It’s simply math. It’s what you do with that math – that’s the magic.  And that’s why every team needs access to digestible data and why self-service data analytics should be a priority for you. It certainly is for us.

This week we offer a process for helping you do just that. It’s a practical 5-step approach that starts with goal-setting and collaboration. Read on.

Read More

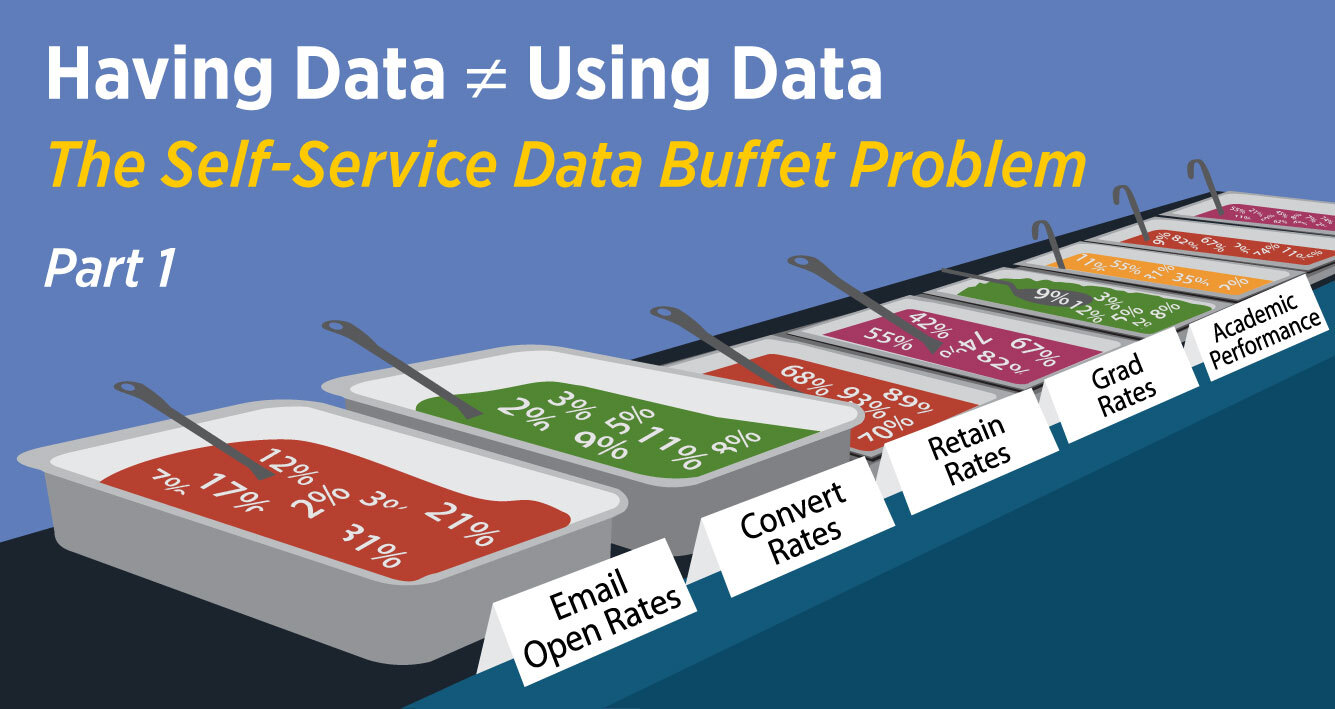
Having Data ≠ Using Data Part 1

You only thought you were using data to make smart decisions.

Understanding how to use data to support institutional planning and growth requires talents and skills that are learned and practiced and honed over time. All these tech companies selling tools and platforms into our systems want leadership to believe that all is simple, clear, and that their dashboards will transform your operational planning and decision making. Wondrous growth is just a click or two ahead. If only.

You’ve tried to create a self-serve data buffet for your leadership team so that they can dive in on their own and make informed decisions.

But…what if they’re not?

We mean, you gave your full team access to the tools with loads of features and data reporting. In the realm of marketing, your CRM captures and reports on email open rates, click through rates, conversion rates, and so much more. Your marketing dashboard tools pull data from Facebook’s Business Manager and Google Analytics (with updates to GA4 that your team is scrambling to implement and fine tune as you read this).

We all want to eke every last drop of data from the platforms available to us now.

Truth is, in the battle of data informed decisions vs human nature, human nature usually wins. Reality: creating, viewing, and understanding reports is not as simple as the tech vendors tell you it is.

Many of your leadership team are simply not data people. They may grab some of the data that supports their ideas, but ignore relevant data that would add more insight, nuance, or might even negate their suppositions.

What we have seen over the last decade is that many organizations are assuming their team’s new access to data dashboards and tools will naturally result in effective use of those tools. Often leaders simply don’t prioritize learning the necessary bells and whistles in the midst of other important deadlines. Still others can’t wrap their heads around it. They have other skills that your institution values and data analysis/interpretation is simply not one of them.

Simple test: Your marketing dashboard provides you with your email open rate monthly average. Among your other standard emails last month, on the 10th your team sent a mass email to a newly purchased, cold email list. What is worth reporting on to your leadership team? How can the data available inform your decisions and actions?

Read on to learn more about what self-service data is, why it can be useful, and how to actually make it work for you. (Oh, and we answer the question about the email open rates).

Read More

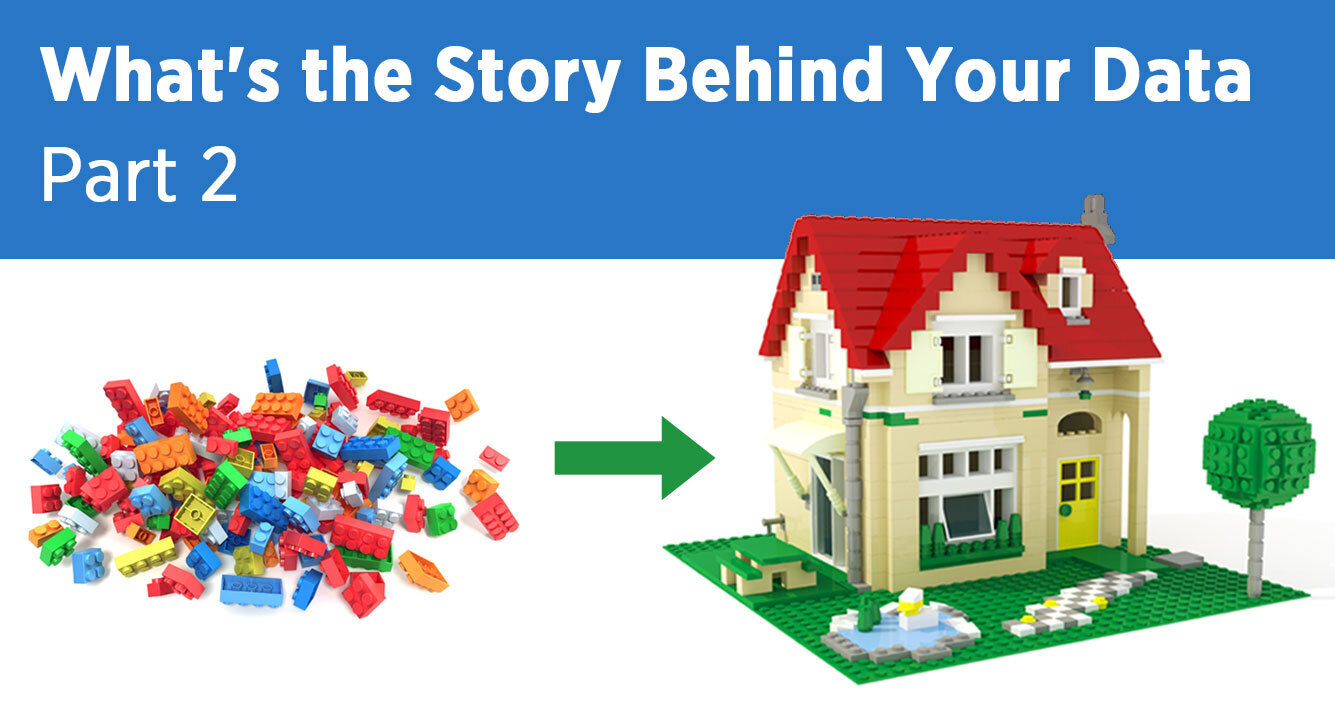
What’s the Story Behind Your Data? Part 2

Last week we shared stories of clients’ unexpected results from our analysis derived from data they had on hand. Insights that helped them improve their enrollment management and enhance recruitment channels they didn’t even know they had.

Success comes from translating your data into insights that point to actionable tasks to improve your operation, and your results. 

This is work that Patricia Tozzi, our Chief Strategy Officer, engages in every day with our team. In Part 2 of this blog series, she discusses more actionable steps around data translation. Those of you who have worked with her have seen the results. This week we focus on where to start.

Side note: if you’ll be attending the 2022 AIEA conference in New Orleans (Feb 20-23), be in touch and we’ll find time for a coffee and an exchange of ideas.

Read on for Patricia’s take on finding meaningful data and putting it to work…

Read More

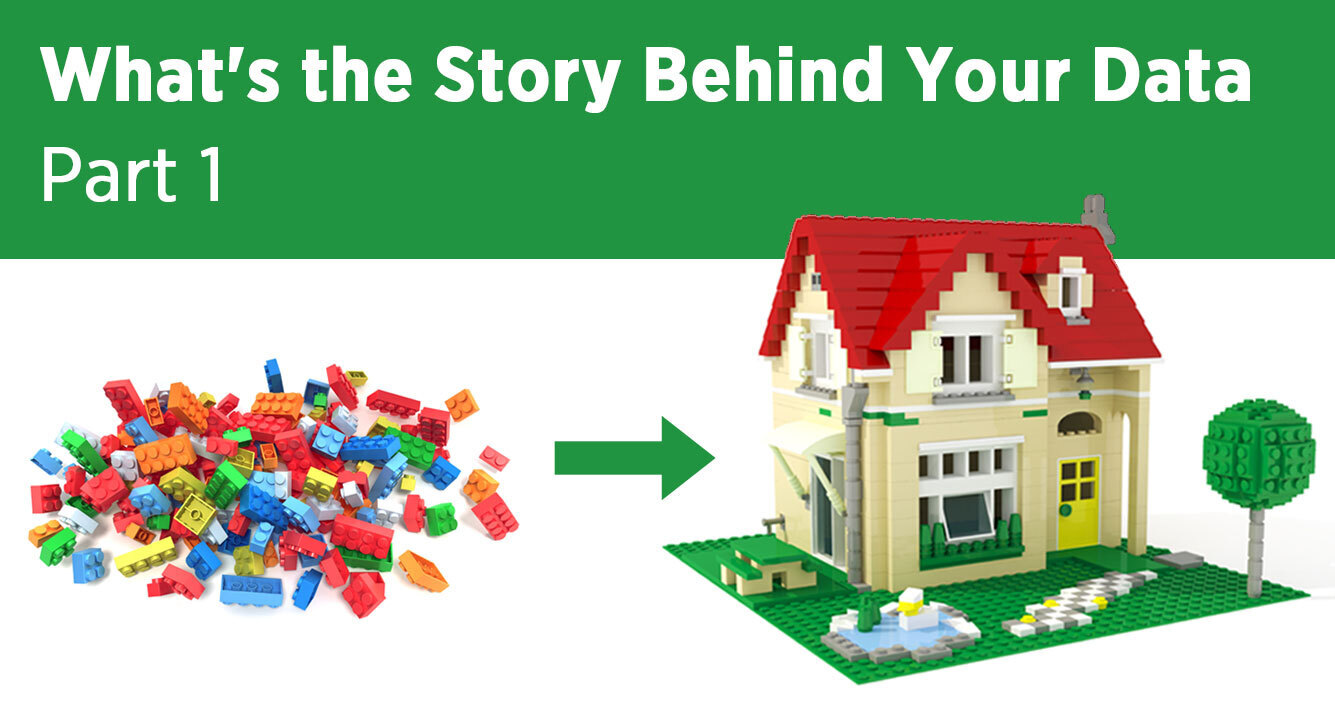
What’s the Story Behind Your Data? Part 1

There’s so much richness behind data analysis. However, it’s not very often that institutions fully explore the data already available at their fingertips.

Today’s post comes from Patricia Tozzi, our Chief Strategy Officer. Taking a quick break from her directing Intead’s client campaigns, we asked her to give us perspective on how she approaches the inquiry into all the data that surrounds us. How she deploys her innate curiosity to develop campaigns that succeed for our clients.

We hear the desire to improve marketing efforts, innovate, and influence decisions that will result in real enrollments. Yet, it’s hard to get new ideas to take off due to limited resources and institutions’ slow-moving pace. This we all know from our years of experience working with academic institutions.

Our take is there are valuable, free resources you may be underutilizing (or not using at all) that can help you gain insights and, hopefully, lower some barriers to innovation. 

Thomas F. O'Toole, associate dean for executive education and clinical professor of marketing at the Kellogg School of Management of Northwestern University, expresses our experience so well, “I hear people say ‘We need data scientists.’ Well, yes, very selectively—but what you need more broadly are people in different types of functions who are able to translate business needs and problems into data analytics, manage the data required, perform the analytics, and then apply the analytic output in the execution of marketing initiatives and activities.”

Patricia is such a translator.

What we often see are academic leaders who smile, nod, and make a joke about their math skills not being what they should be. Is this you?

No shame in recognizing your skills and skills gaps. But what are you doing about it? Because leaving all that data untapped is not an option.

Read on to learn how to tap into what your existing data is trying to tell you. We think this two-part series is one you’ll want to share more broadly within your institution.

And, if you’ll be attending the 2022 AIEA conference in New Orleans (Feb 20-23), be in touch and we’ll find time for a coffee and an exchange of ideas.

Read More

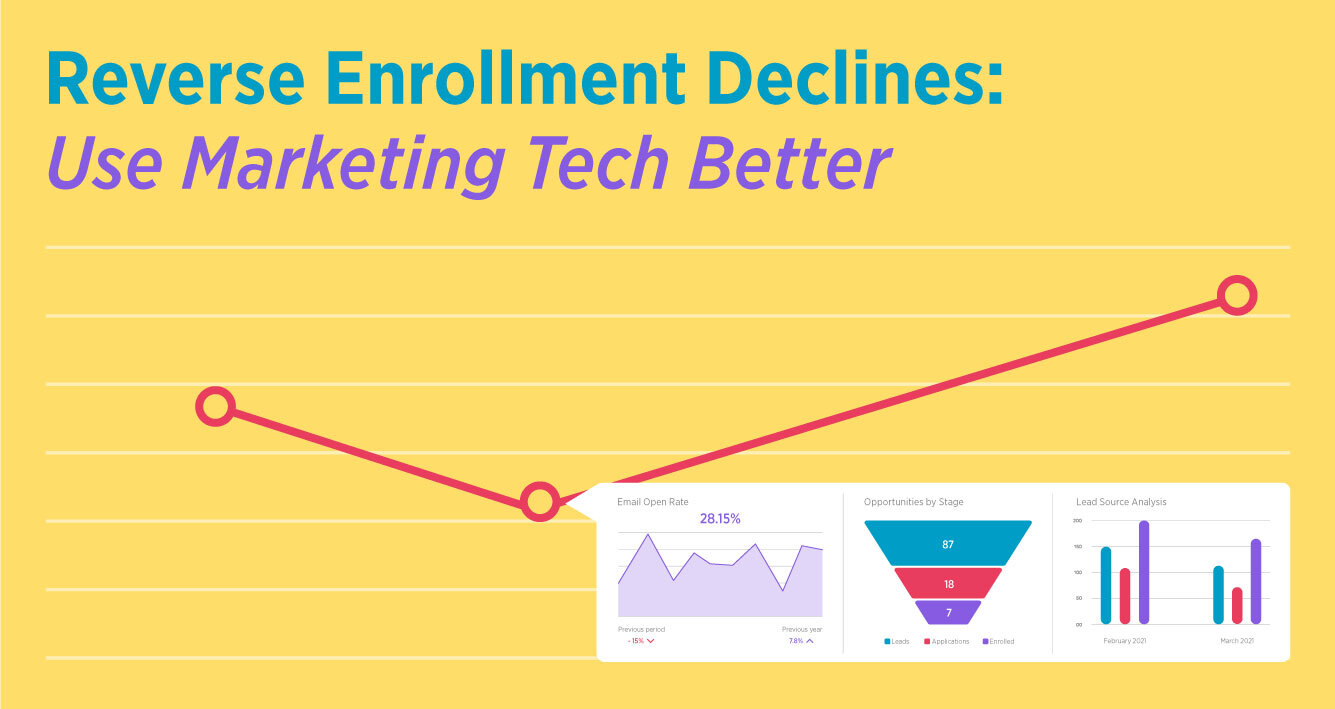
Reverse Enrollment Declines: Use Marketing Tech Better

So many dashboards. So little time.

Where is success hiding? How much investment will it take to achieve our targets?

With student mobility still in a state of flux, all bets are off for your predictive models. Or are they?

Today, we are talking to those with a CRM and marketing automation tools already in place.

Is this you? Your system works well enough and you can see some obvious gaps in functionality and interconnectedness. But you have what you have and there is no immediate opportunity to upgrade or change what you have. So…it is all about using the tools you have, better.

How do we get there? How do we know which features have real value to our operations? How can we use what we know to achieve better results?

We are heading into four wonderful days of interacting with our peers at the AIRC conference in Miami this week. The Intead team will be presenting on innovative ways to use the rising tide of influencer marketing for academia (it’s not going to be what you might think), and we will be presenting on innovative approaches to grad student marketing.

We can’t give enough thanks to our colleagues Toni Jaeger-Fine from Fordham Law School, Ita Duron from Massachusetts College of Health Sciences, and Kirsten Feddersen from Northeastern University all joining us on the dais to share our experiences and ideas. SO many ideas. Testing and confirming marketing approaches that are unique to each institution’s strengths.

Reach out if you would like to share a cup of coffee in Miami!

Read on for our two concrete recommendations for using your marketing tech better.

Read More

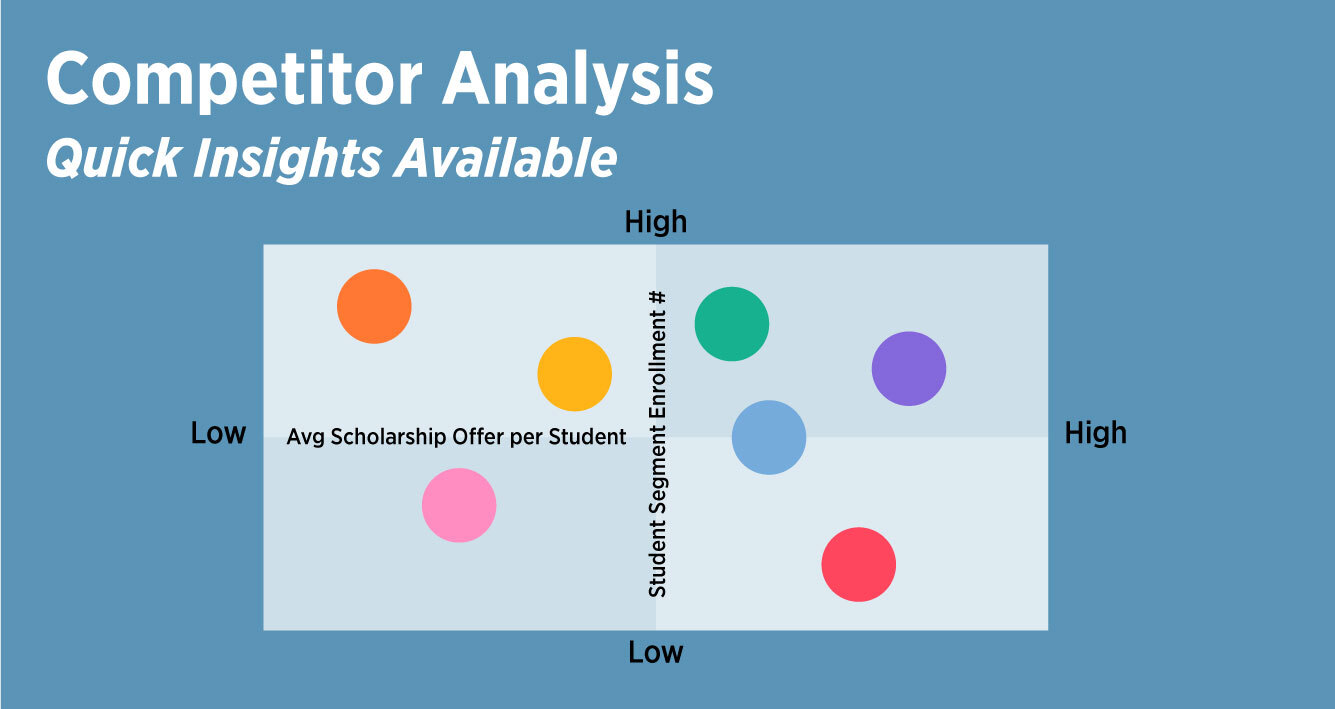
Competitor Analysis: Quick Insights Available

Every enrollment VP is fighting for students who will add value to their institution. Domestic is heading for the 2025 cliff while international is beginning to rebound from the pandemic travel restrictions. 

What better way to win market share than to tell the story that differentiates your institution? This week, for those of you not already familiar, we introduce you to Jon Boeckenstedt and a tool he’s created that can help you see quickly how your institution stacks up to your competition. Jon’s work consistently brings data insights and knowledge of the field to help institutions make better enrollment management decisions.

On the international side of things, be sure to register for the AIRC conference coming up in December where we will be presenting two valuable learning opportunities alongside colleagues from Northeastern University, Fordham Law School, and San Diego State University. Early bird rates are still on the table! See link below. And see you in Miami!

Read on to dive into the amazingly fast competitor insights you can gather and how you might use them to put the best version of your institution’s story out there. 

Read More

Why Your Data Isn’t Getting You Where You Want to Go

With data becoming increasingly available and important to your team’s decision making, there’s more pressure than ever to keep up. New tools, better dashboards, queries—all in the name of working smarter and producing better, more efficient results.

But with all of this data at your disposal, it’s not always easy to identify which information to use and when…or how. At the end of the day, it’s about filtering out the noise and focusing on the KPIs (Key Performance Indicators). But in any given initiative, what are the KPIs and where do you find them? Are they the right ones?

Pro tip: Your first picks at KPIs prior to a new initiative running are often not the ones you end up focusing on once your boots hit the ground. Ongoing refinement is an essential part of the process. Dashboards were meant to be adjusted.

Another key factor: How do you make those data point selections and refinements? And who is doing that all-important data analysis and interpretation?

We’ve seen more teams than we can count create operational data portals using one tool or another, all in the name of deeper insights and more informed strategic planning. However, those “deeper insights” rarely amount to anything more than an overcomplicated dashboard and maybe some slide deck fodder that the rest of the team struggles to understand. Hopefully someone on the team has the gumption to ask the presenter: Is 43% good in that scenario? Do we have any context for that? 

You may be wondering why your efforts to make more data-driven decisions don’t always produce the gains you are anticipating (or the gains required by the hefty price tag that many of these data tools and services command.)


NAFSA Update — for those of you attending, Intead sessions to help you move your global enrollment efforts forward:

  • Achieving Global Agility: The Flexibility of Global Campus Options
    A discussion on the challenges and opportunities of delivering your academic programs at turnkey remote campuses around the world. First-hand experiences will be shared. Tune in: June 4th at 9am EDT
  • Going from 0-60: Internationalization
    We’ll be talking all things internationalization with David DiMaria, Associate Vice Provost, International Education at University of Maryland, Baltimore County, focusing on how to build leadership buy-in and navigate typically slow-moving internal processes for rapid results. A Tune In Anytime event.

Back to our data discussion...For most organizations, data difficulties begin and end with the lack of a “data culture”, defined by McKinsey & Company in their 2019 Global Survey as “a set of practices that brings together data talent, tools, and decision making so that data become the default support for company operations.” 

Sounds simple enough, but in execution, defining, and more importantly, implementing that data-friendly “set of practices” becomes nearly impossible for many teams. Data interpretation skills don't always come naturally to everyone on your team. Data presentation skills are even less common. Decisions on when to use a pie chart vs. a bar chart seem basic enough, but there is a lot more to it if you want the data to inform and motivate your team and impress your leadership.

Read on for three common roadblocks that might be standing in the way of your team’s data approach and what you can do about it.

Read More

Moving the Needle on Your International Student Recruitment

So your international enrollment numbers are ok, but not what you need them to be.

Or worse, like many of our colleagues, your numbers took a real dive over the past 12 to 18 months.

What steps can you take that will move the needle north? And north of what? How much growth can you expect? Oh, and how much investment will that require?

Let’s just take a breath and point out that, you ask some really hard questions!

Let’s try to answer them…with DATA!

Read on for some concrete next steps...

Read More

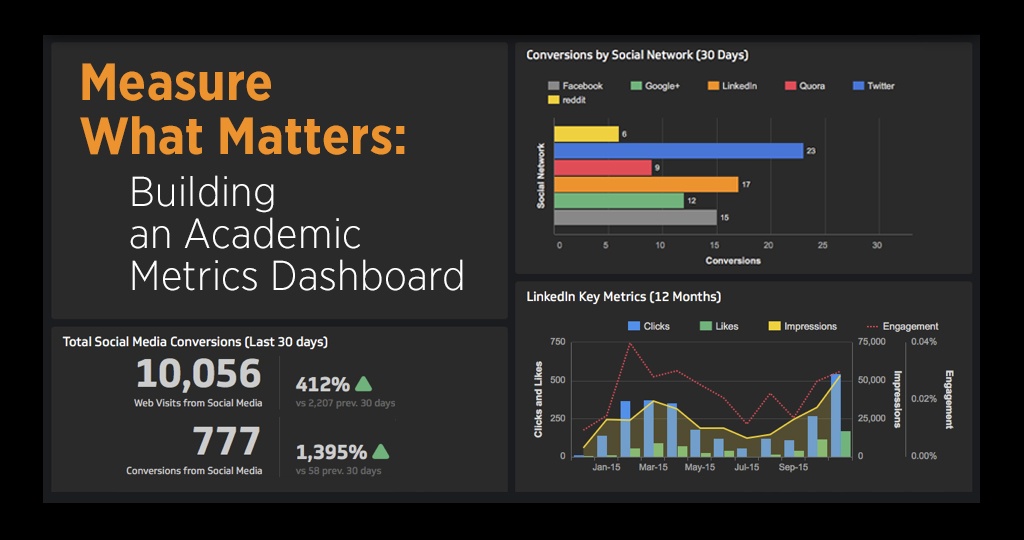
Measure What Matters: Build an Academic Metrics Dashboard

What are the Top 3 Metric Areas you should be tracking? Does your answer match ours?

Former CEO of HP, Carly Fiorina, once said, “the goal is to turn data into information and information into insight.” This is the essence of analytics. It’s exactly why you are (or should be!) taking the time to track traffic on your website and social media engagement. It is all for that valuable insight that can introduce you to the student leads you want and help you understand their needs/motivations.

We know we might sound like a broken record but analytics are important. And we know how difficult it can be to get started. The good news is that it’s not as complicated as you think.

Come meet us in San Diego this weekend (a quick jaunt to the sun!?!) to learn more about metrics, tactics and other international student recruiting approaches from experts in the field at our upcoming International Student Recruitment Bootcamp. It is all about What Works Where.

Have you seen our speaker list? A range of experts, our conference faculty, will be on hand January 29-31. Today is the LAST DAY to take advantage of regular pricing. Spaces are limited and going fast. 

The Bottom Line: The key to successfully tracking analytics is to set up a system that is easy to use and accessible–your dashboard. Just like your car dashboard, a metrics dashboard stores all your “go-to” data in one place. This can help know how your digital marketing is performing. If you take the time to do this regularly, a big IF based on what most of us have time for, you will spend your marketing budget more wisely every year. If nothing else, your bosses will be proud of you for that ;-)

Trying to collect data without setting up a dashboard is like trying to make a recipe you’ve never made before without the ingredients list. You might know where to find one or two of the pieces of data you are looking for, but you need to know how to piece them together to make a tasty meal. Read on for our list of the Top 3 Metrics Areas we think you should be keeping tabs on. This is the kind of data we think should be on your dashboard to support your international student recruitment efforts.

Pro tip: this is one of those posts you’ll want to share with a select few others on your team.

Read More

U.S. Election Could Significantly Affect Your Enrollment Numbers


Learn more in Room CCC, Mile High Ballroom 4DE TODAY at 10AM.


If Hillary Clinton is elected President of the United States, will international student enrollment decline in the U.S.? How about if Donald Trump is elected? Intrigued? We have some data you might want to see.

Today, Intead and FPPEDUMedia will be releasing our latest research results with deep country insights to inform your global marketing campaigns. As you seek to maintain or expand your international student recruiting efforts, our data will be valuable to your decision making – where to invest, which programs to highlight in which countries, what messaging to use.

With FPPEDUMedia’s extensive and global international student database, we are able to identify regional trends and inform our digital marketing plans and investments. A remarkable advantage.

This winter, we sent a survey to 1.2 million prospective international students who have profiles in FPPEDUMedia’s database. We asked them how political and economic turbulence affected their plans to study abroad. We asked questions about what influences their actions that we’ve not seen asked before. And we got some great answers. In fact, we received more than 40,000 answers…in just 7 days. Now that’s engagement!

Want the scoop? Read on...

Read More